Planning a transfer from one orbit to another is in general a complicated tradeoff of factors. Once the transfers go beyond the simple textbook examples involving co-planar circular orbits the cost of the transfer depends on departure time and arrival time (arrival time implying a choice of transfer duration). The tool used by mission planners to examine these tradeoffs is a 2D plot of arrival time vs departure time for a Lambert transfer. Since the contours on such plots reminded someone of pork chops, they have become known as porkchop plots.
GE 7.0 provides classes to compute the transfer parameters and the means to display them in a scene and allow a user to click on a point in the plot and see the corresponding orbit transfer. This is an excellent way to evaluate transfer choices.
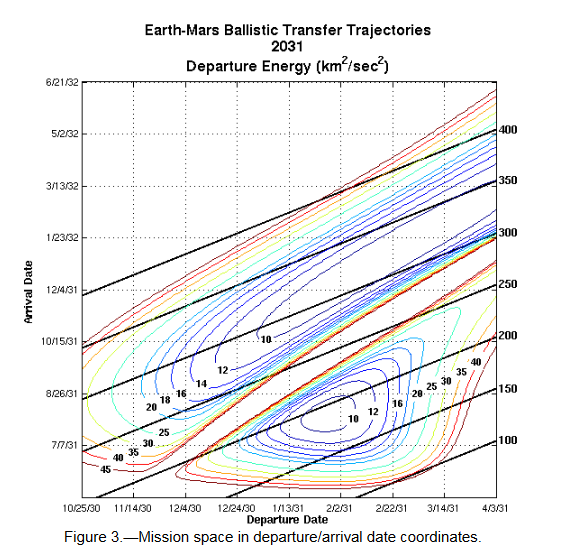
This specific example was chosen to correspond to the example given in the NASA mission planning document.
Interpreting the plot
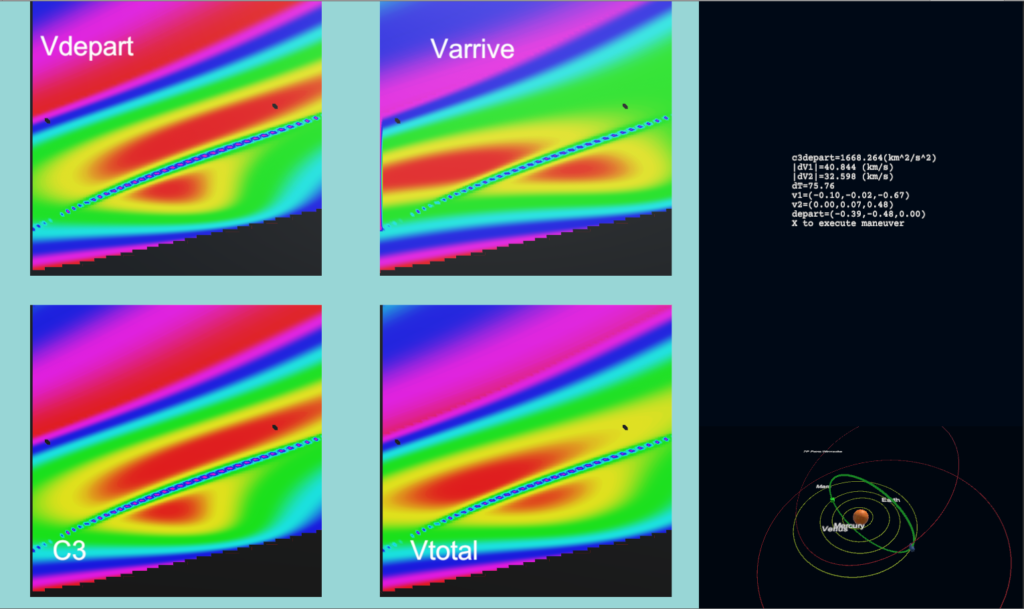
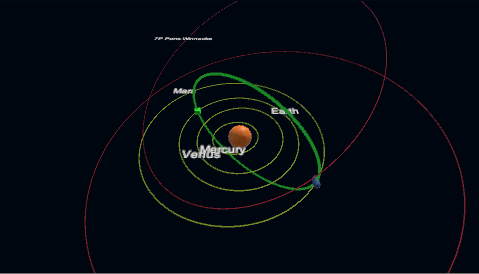
The Earth-Mars plot has some interesting attributes. Recall that Earth and Mars orbits are not co-planar nor are they circles. This results in some cases where specific departure/arrival combinations can vary significantly in delta-V. An Earth-Mars Lambert transfer is an orbit that is in the plane defined by the Sun, Earth and Mars. In cases where these form a plane close to the plane of the Earth orbit the delta-V cost is near it’s minimum. In cases where the plane is tilted strongly with respect to the Earth plane, this results in a transfer orbit with significant inclination change and a corresponding large value of delta-V. This is the green ridge running diagonally between the red regions. Using the sample scene EarthMarsPorkchop you can click in on this ridge and see the corresponding orbits:
Using LambertPorkchop
LambertPorkchop is the primary implementation class for porkchop plots. In addition the plots themselves are implemented using the PorkchopMesh class.
The inspector view of LambertPorkchop is:
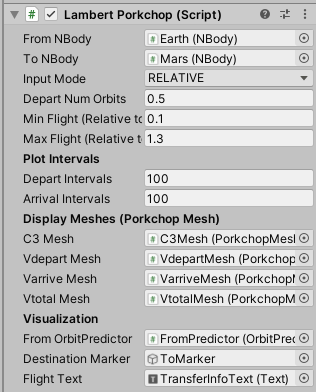
The script allows two modes for providing the range of departure and arrival times:
RELATIVE MODE: This mode makes reference to the departure orbit period and expresses the departure time in the number of departure orbits from the present position. The mode also requires the minimum and maximum flight time be specified as a multiple of the idealized Hohmann transfer time (assuming the departure and arrival orbits are circular and co-planar). The relative mode allows a porkchop plot without a need to compute exact orbital periods.
ABSOLUTE MODE: The start and end time (in GE time units) for the departure and arrival times are entered directly.
PLOT INTERVALS: These values determine the number of data points that will be computed for the transfers. The total number will be the product of these two intervals; large values may result in significant computation. The LambertPorkchop script contains an optimized copy of the LambertUniversal.
DISPLAY MESHES: Each plot required a PorkchopMesh in the scene. See below for a description of these meshes.
VISUALIZATION: The display meshes support a click mechanism that calls LambertPorkchop to request orbit visualization for a point on the data mesh. This code uses an orbit predictor for the from object and a target game object to illustrate the orbit for the data point that was clicked.
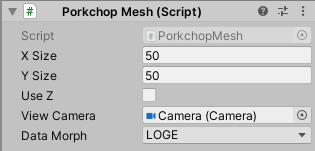
PorkchopMesh
The PorkchopMesh class generates a mesh using an integer array of data values procided by a DataGrid class. In the LambertPorkchop scenario this is provided by the code that computes the transfer data for the range of departure and arrival intervals.
The range of data values is rescaled into the interval (0..1) and used to select a color (u,v) for each vertex based on the value of the function. When couples with a texture that shows a color gradient this provided a color coding of the function value at the mesh point.
A DataMorph parameter allows the data to be used as-is or to be scaled using LogE or Log10.
Optionally the z value of the mesh can be set based on the function value to provide a 3D representation of the data.
The PorkchopMesh provides a mechanism for a click on a data point to call a delegate function (in this example LambertPorkchop). For this reason a reference to the camera viewing the Porkchop mesh is required.
The inspector view of PorkchopMesh is: